Order Flow Toxicity of the Bitcoin April Crash
Introduction
This article describes a frequently discussed measure of informed trading in the financial world and how it can be applied to Bitcoin data. The described technique received a lot of publicity (reuters, bloomberg, cornell, tabbforum) in the last years as some authors praised it to be a good leading indicator of financial crashes.
As Bitcoin suffers under frequent mini crashes it would be useful for traders and investors alike to have such an indicator of market distress. I implemented the technique and applied it to the aftermath of the April Bitcoin crash, the most severe crash in its history.
All code and data is available on github.
Introduction to Order Flow Toxicity and PIN
Information based market-making models aim to explain the bid ask spread due to asymmetric information -- some traders are better informed than others about the true value of the traded asset. Consequently, a market-maker who continuously offers bid and ask quotes has to have a buffer (the spread) which protects his quotes from being adversely selected by better informed traders.
An influential paper [1] describes such a model by using the concept of informed and uninformed traders. I will briefly describe the concepts introduced in that paper.
A perfectly informed trader is one that only buys when an asset is undervalued and only sells when an asset is overvalued. Trading against informed traders is then a bad thing since any execution from an informed trader means you received a bad price. This is especially important when you trade with limit orders all day long at a high frequency, as market-makers do. Order flow is said to be toxic (from a liquidity provider perspective) if the people you trade against have a better idea than you about the fundamental price. Thus, it is not surprising that there is a branch of market-making research solely concerned with estimating the level of informed trading.
The paper further describes a way to model bid and ask prices based on the arrival of "good" and "bad" information. This leads to the sequential trade model of market-making, which derives break-even conditions for a liquidity provider given arrival rates which are explained in the next paragraph.
The authors assume uninformed traders always buy and sell no matter whether good or bad news arrived. Informed traders only buy on good news and sell on bad news. Information events are independent and happen with probability \(\alpha\). Good news happens with probability \(1-\delta\), while bad news happens with \(\delta\). Trades come from both informed and uninformed traders with both traders assumed to be determined by an independent Poisson process. Uninformed traders arrive with rate \(\epsilon\) while the arrival rate of informed traders is \(\mu\).
Thus, on a good news day, the arrival rate is \(\epsilon + \mu\) as both types of traders will trade. On a bad news day the arrival rate for buy trades is \(\epsilon\) only while the arrival for sell trades is again \(\epsilon + \mu\).
The authors eventually derive the break even condition provided by the model. This condition contains a factor that can be interpreted as the probability of informed trading occurring. The factor is the following
$$PIN = \frac{\alpha \mu}{\alpha \mu + 2 \epsilon}$$
This can be explained as the proportion of orders originating from informed traders (\(\alpha \mu\)) in relation to the total order flow (\(\alpha \mu + 2 \epsilon\)).
The various arrival rates above have to be estimated from order arrival data. This turns out to be tricky since none of the parameters can directly be observed in the data. In addition, the assumption of the arrival distribution is questionable.
VPIN
Recently, Easley, de Prado, and OHara [2] have suggested an adapted metric which is easier to estimate and more useful in practice called Volume Synchronized Probability of Informed Trading (VPIN).
The most important aspect of VPIN is that it is calculated in volume-time instead of wall-clock or trade-time. In volume-time the time axis consists of equal sized volume buckets -- i.e. the number of trades are aggregated together to make up a certain fixed amount of volume.
The authors argue that it makes sense to compare periods of equal information (i.e. volume) exchanged. Among other things, this addressed trade clustering by producing more volume-time samples during high volume periods to smoothen out such information bursts.
They show that VPIN is a good estimate of PIN with expected volume imbalance between sell and buy classified trades in a given bucket being
$$E[|V_S-V_B|]\approx\alpha\mu$$
and expected total number of trades is
$$E[V_B+V_S]=\alpha\mu+2\epsilon$$
Since the second expectation above is constant across the whole trading period (since every volume bucket is the same size) this leads to the following, simple VPIN toxicity measure where the sum is over n volume buckets
$$VPIN=\frac{\alpha \mu}{\alpha \mu + 2 \epsilon}\approx\frac{\sum{E[|V_S-V_B|]}}{nV}$$
To compute VPIN you have to specify the volume size V and an averaging period n. The authors give the example that if V is chosen to be one fiftieth of the daily volume and n=50 then this corresponds to finding a daily VPIN.
Flash Crash and VPIN as crash metric
In another paper [3] the authors argue that VPIN is a good leading indicator of volatility, as demonstrated by their analysis of Flash Crash data which shows growing order flow toxicity during the hours leading up to the crash.
A figure from the paper shows the VPIN measure and E-mini SP500 ticker during the hours of the flash crash.
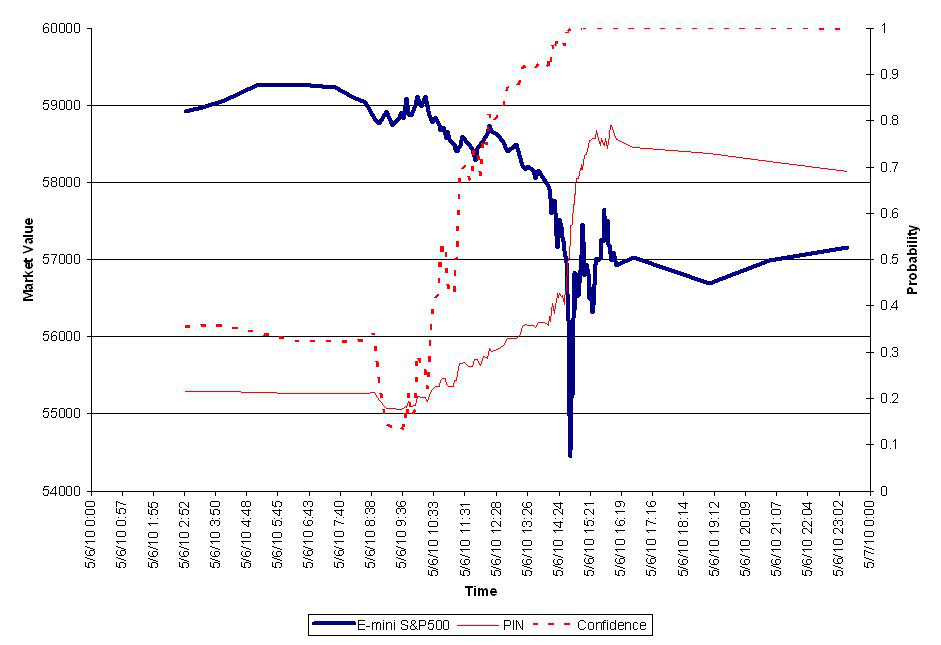
We see how VPIN gradually increases leading up to the event. It peaks after the event around 0.8 and then slowly decreases. The paper concludes by suggesting VPIN as a real-time indicator of order flow toxicity which could be used by market-makers and exchanges alike as a warning of impending market turmoil.
These are quite strong claims and naturally lead to a bit of a dispute by people trying to show how they cannot reproduce the volatility-leading characteristics of VPIN [4, 5].
I do not take either side of this argument, however it is still interesting to apply VPIN to Bitcoin exchange data as Bitcoin is known to be extremely volatile with frequent crashes. Being able to monitor order flow toxicity and react to upcoming volatility would be useful to any type of trader.
So let us have a look at computing VPIN on trade data recorded from MtGox.
Calculating VPIN using Bitcoin historical data
We examine the time period of 15 April to 3 May. The beginning of the period is a few days after the market crashed from its all-time high of around $250 down to around $70. Thus, this time frame is interesting as it contains a lot of uncertainty and volatility from the aftermath of the biggest panic selling in the history of Bitcoin. The data consists of millisecond resolution of almost 470'000 trades of a total volume of 2.5 million BTC.
We use the algorithm described in [6] to calculate VPIN (implementation available here). The only three parameters to decide on are the fixed size of volume buckets, the time bar resolution, and the averaging period. Once the parameters are chosen, time bars and volume bars can be calculated.
The core of the VPIN calculation is the Order Imbalance (OI). This is the absolute difference of sell and buy volume within one volume bucket. This is computed by converting 1 minute time bars into unit (1BTC) volume transactions. Thus if the median 1 minute volume is 20BTC, then this is transformed into 20 individual transactions of 1BTC, all receiving the trade sign assigned to the given minute. The unit volume transaction series is then grouped into equal sizes volume buckets. OI can be trivially calculated from that. VPIN is then simply the moving average of OI over a number of volume buckets.
We consider volume buckets the size of 500 BTC, which correspond to about one fifteenth of MtGox daily trading volume. These are relatively large buckets compared to the financial VPIN papers, but due to the extreme dispersion of order sizes (median is 0.5BTC while maximum is 3300BTC) and the 1 minute trade sign aggregation to small buckets, it would result in some buckets containing many small orders while many consecutive buckets would be filled by a single large trade.
We also use 1 minute time bars and assign the most common trade sign within that minute as the sign. In contrast to financial data, MtGox provides trade signs for every trade, thus we do not have to use trade classification heuristics.
The calculation necessary to recreate the graphs below and the data itself is available on github. I use the excellent Pandas python package which makes alignment, resampling, and grouping of timeseries much easier. One word of warning, I am sure the whole code could be re-written in one or two elegant Pandas groupby (perhaps a VolumeGrouper?) statement.
Results
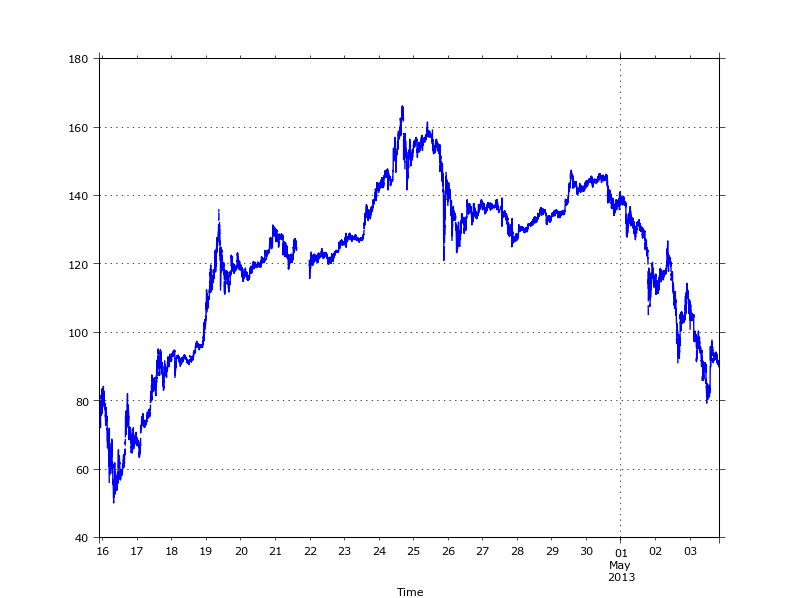
The trades over the given period show the initial bottom at around $50, a recovery to $160 at the end of a month and a second, fast depreciation at the beginning of May.
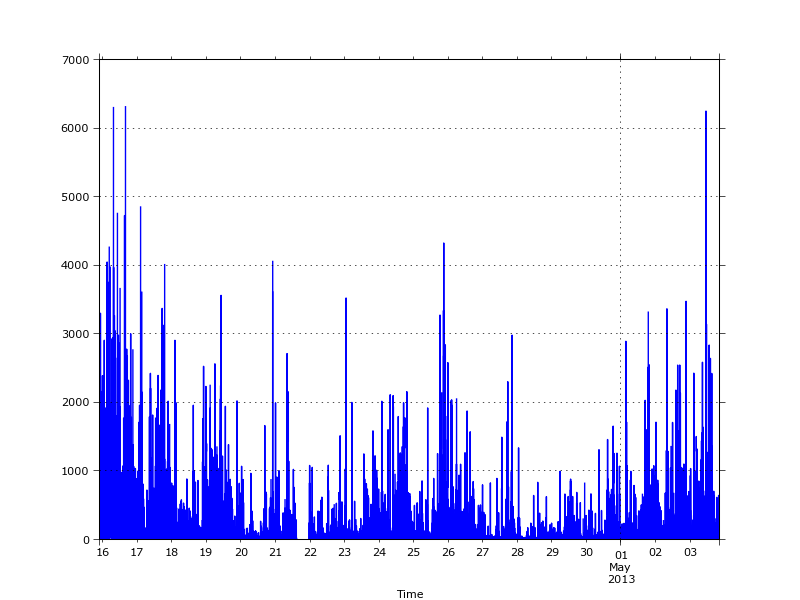
The volume over the same period clearly shows the clustered nature of volume.
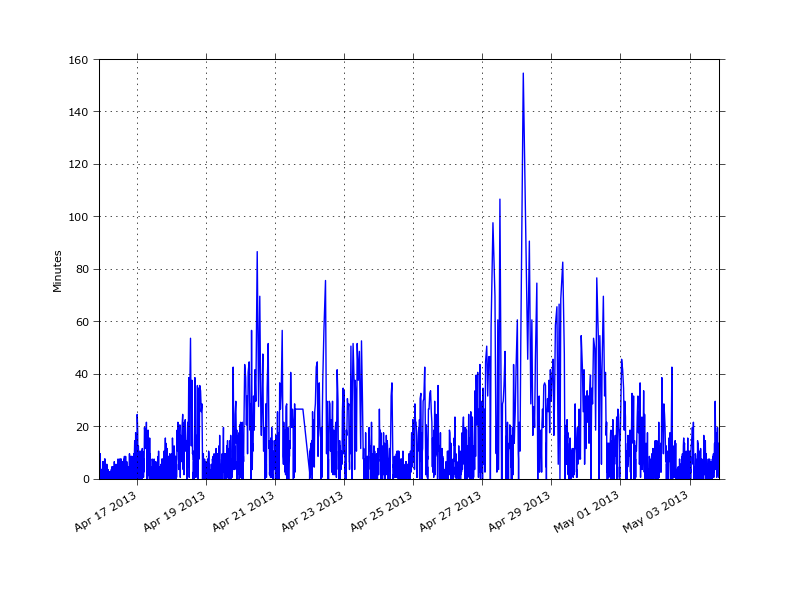
The next graph shows the time required to fill a volume bucket of 500BTC (on the y-axis). We can see that the duration of a volume bucket varies a lot; from a few seconds during the most active times to a maximum of 155 minutes. Especially right after the second crash on 17 April most buckets are below 5 minutes -- most likely made up of traders who are either getting rid of their inventory or who are 'buying the dip'.
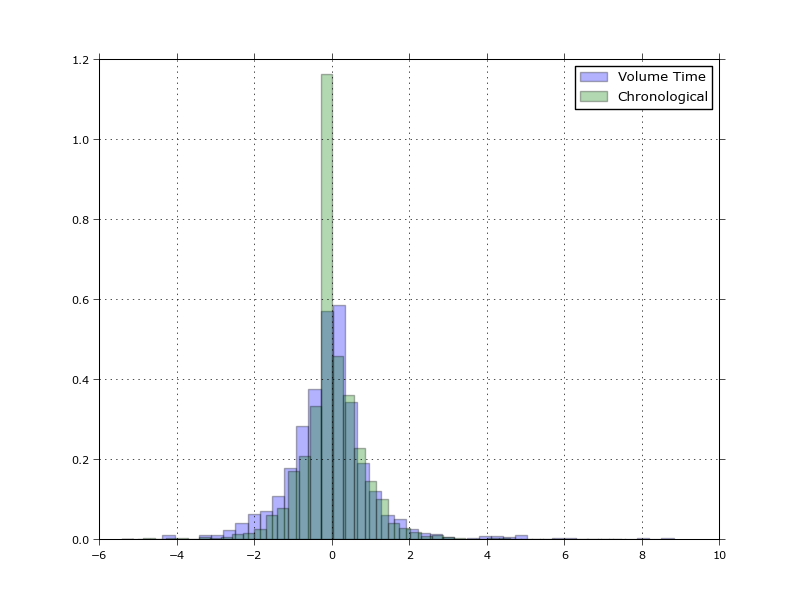
Also of interest is the (normalised) price distribution of the volume time returns versus the normal chronological time, as shown in [2]. The volume-time distribution is closer to an i.i.d normal distribution than the chronological time, which could be used as argument for using volume-time when analysing high frequency trade data.
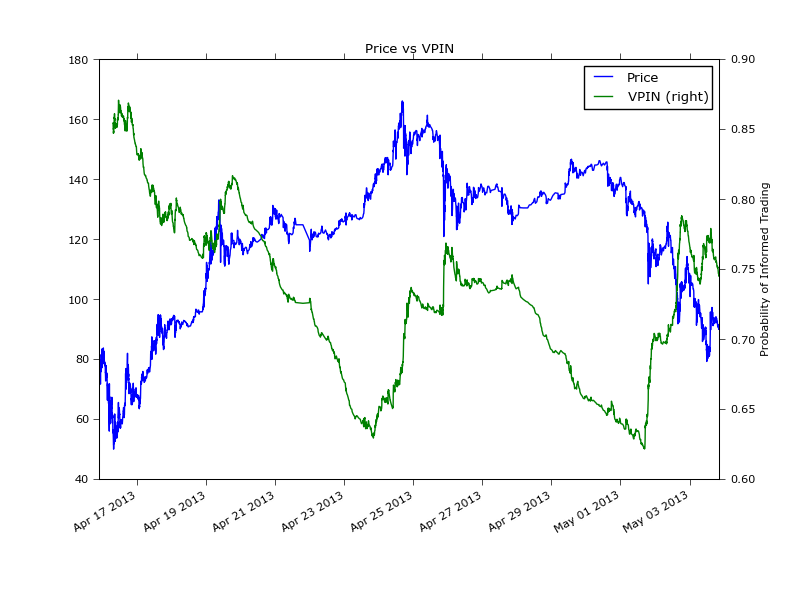
Finally, an overlay of the price movement and VPIN over the whole period. During the 15 and 17 April VPIN is above 85% indicating high levels of toxicity -- similarly to the levels of toxicity after the flash crash. As the price recovered over the following days VPIN declined to around 63%. Toxicity peaked again twice in the period, around 26 April and 2 May which is just at the start of or during smaller price corrections.
Naturally, this graph alone is not enough to conclude whether VPIN is a good crash indicator, for that we would need to study the baseline VPIN levels over a much larger period and compare how it correlates with future volatility, just like the authors in [2, 3] did. However, it looks like a good value-add to monitor VPIN if you are heavily invested in Bitcoin.
References
[1] D. Easley, N. M. Kiefer, M. O'Hara, J. B. Paperman: Liquidity, Information, and Infrequently Traded Stocks ssrn.
[2] D. Easley, M. M. Lopez de Prado, M. O'Hara: Flow Toxicity and Volatility in a High Frequency World pdf.
[3] D. Easley, M. M. Lopez de Prado, M. O'Hara: The Microstructure of the 'Flash Crash' pdf.
[4] T. G. Andersen, and O. Bondarenko: VPIN and the Flash Crash ssrn.
[5] The Trouble with VPIN link.
[6] D. Abad, and J. Yague: From PIN to VPIN: An introduction to order flow toxicity pdf.
[7] A. Cartea, S. Jaimungal, and J. Ricci: Buy Low Sell High: A High Frequency Trading Perspective ssrn.
comments powered by Disqus